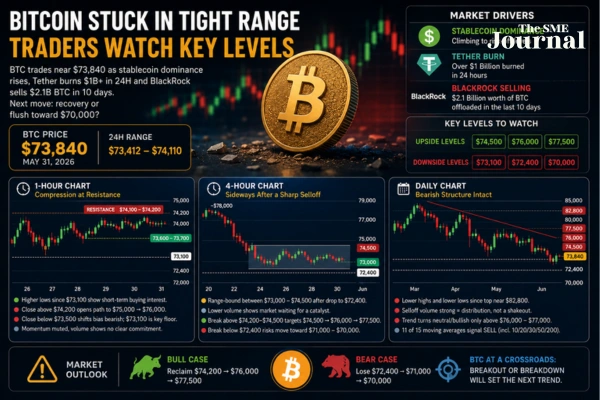
Bitcoin hovered around $73,840 on May 31, 2026, trading within a narrow range between $73,412 and $74,110 as investors weighed conflicting market signals. While some indicators suggest growing caution, others point to potential accumulation at current levels.
Market sentiment has become increasingly defensive, with stablecoin dominance rising and Tether burning more than $1 billion worth of tokens in the past 24 hours. Adding to the uncertainty, BlackRock has reportedly sold around $2.1 billion worth of bitcoin over the last ten days. As a result, traders are closely monitoring several key price levels to determine whether Bitcoin is preparing for a recovery or another leg lower toward the $70,000 mark.
1-Hour Chart: Bitcoin Trapped Below Resistance
On the 1-hour timeframe, Bitcoin has been forming a series of higher lows since bouncing from the $73,100 area, indicating that buyers are still active. However, every attempt to push above the $74,100-$74,200 resistance zone has been rejected, keeping the cryptocurrency locked inside an increasingly tight trading range.
Immediate support is located between $73,600 and $73,700, while $73,100 remains the key level bulls need to defend. A decisive break above $74,200 could trigger a move toward $75,000 and potentially $76,000. On the downside, a close below $73,500 would weaken the short-term structure and shift attention back to $73,100 and then $72,400.
For now, momentum remains relatively subdued, with trading volumes offering little confirmation of a clear directional move.
4-Hour Chart: Consolidation Following a Sharp Drop
The 4-hour chart highlights a market that is still digesting a steep correction. Bitcoin fell from around $78,000 to a low near $72,400 before settling into a sideways range between $73,000 and $74,500.
Trading volume has gradually declined during this consolidation phase, suggesting that both buyers and sellers are waiting for a stronger catalyst before making their next move.
Some traders view the current structure as a potential accumulation zone, although a breakout is still needed to confirm that view. Aggressive buyers are watching the $73,000-$73,300 region for entries, while more conservative traders may prefer to wait for a sustained move above $74,200-$74,500.
If Bitcoin breaks higher, the next upside targets are $74,500, followed by $76,000 and $77,500. However, a drop below $72,400 would invalidate the consolidation setup and could open the door to a deeper decline toward the $71,000-$70,000 region.
Daily Chart: Bears Still Hold the Advantage
The daily chart remains challenging for bullish investors. Since peaking near $82,800, Bitcoin has consistently formed lower highs and lower lows, maintaining a clear downtrend.
Although the recent bounce from $72,400 has provided some relief, there has been no strong reversal signal or breakout that would indicate the broader trend has changed.
Trading volume increased during the recent selloff, suggesting genuine selling pressure rather than a temporary market shakeout. Key resistance levels on the daily timeframe are positioned at $74,500, $76,000, and $77,500.
Until Bitcoin can reclaim the $76,000-$77,000 zone on a daily closing basis, the broader outlook remains neutral to bearish. Supporting this view, TradingView's moving-average indicators continue to lean negative, with 11 of 15 major moving averages currently flashing sell signals, including the widely watched 10, 20, 30, 50, and 200-period averages.
For now, Bitcoin remains at a critical crossroads. A breakout above resistance could revive bullish momentum, while a breakdown below support may increase the risk of another move toward $70,000.


.webp)